Identify tissues in a published Arabidopsis leaf image
Compare a typical warm-grown leaf vein with a real variation in its tissue arrangement.
Core and Extended; Biology 0610, 2026–2028. Use the stated specimen features and evidence. Diagrams are schematic. Written practice is self-checked
Before you begin
- Complete the leaf diagram lesson and scale-bar work.
Work on paper. Try each question before revealing help, and explain why your method works.
Quick readiness check
What does a scale bar let you interpret?
What you will learn
- Locate xylem and phloem in the stated image panel
- Recognise the limits of a positional shortcut
Arabidopsis leaf veins in section
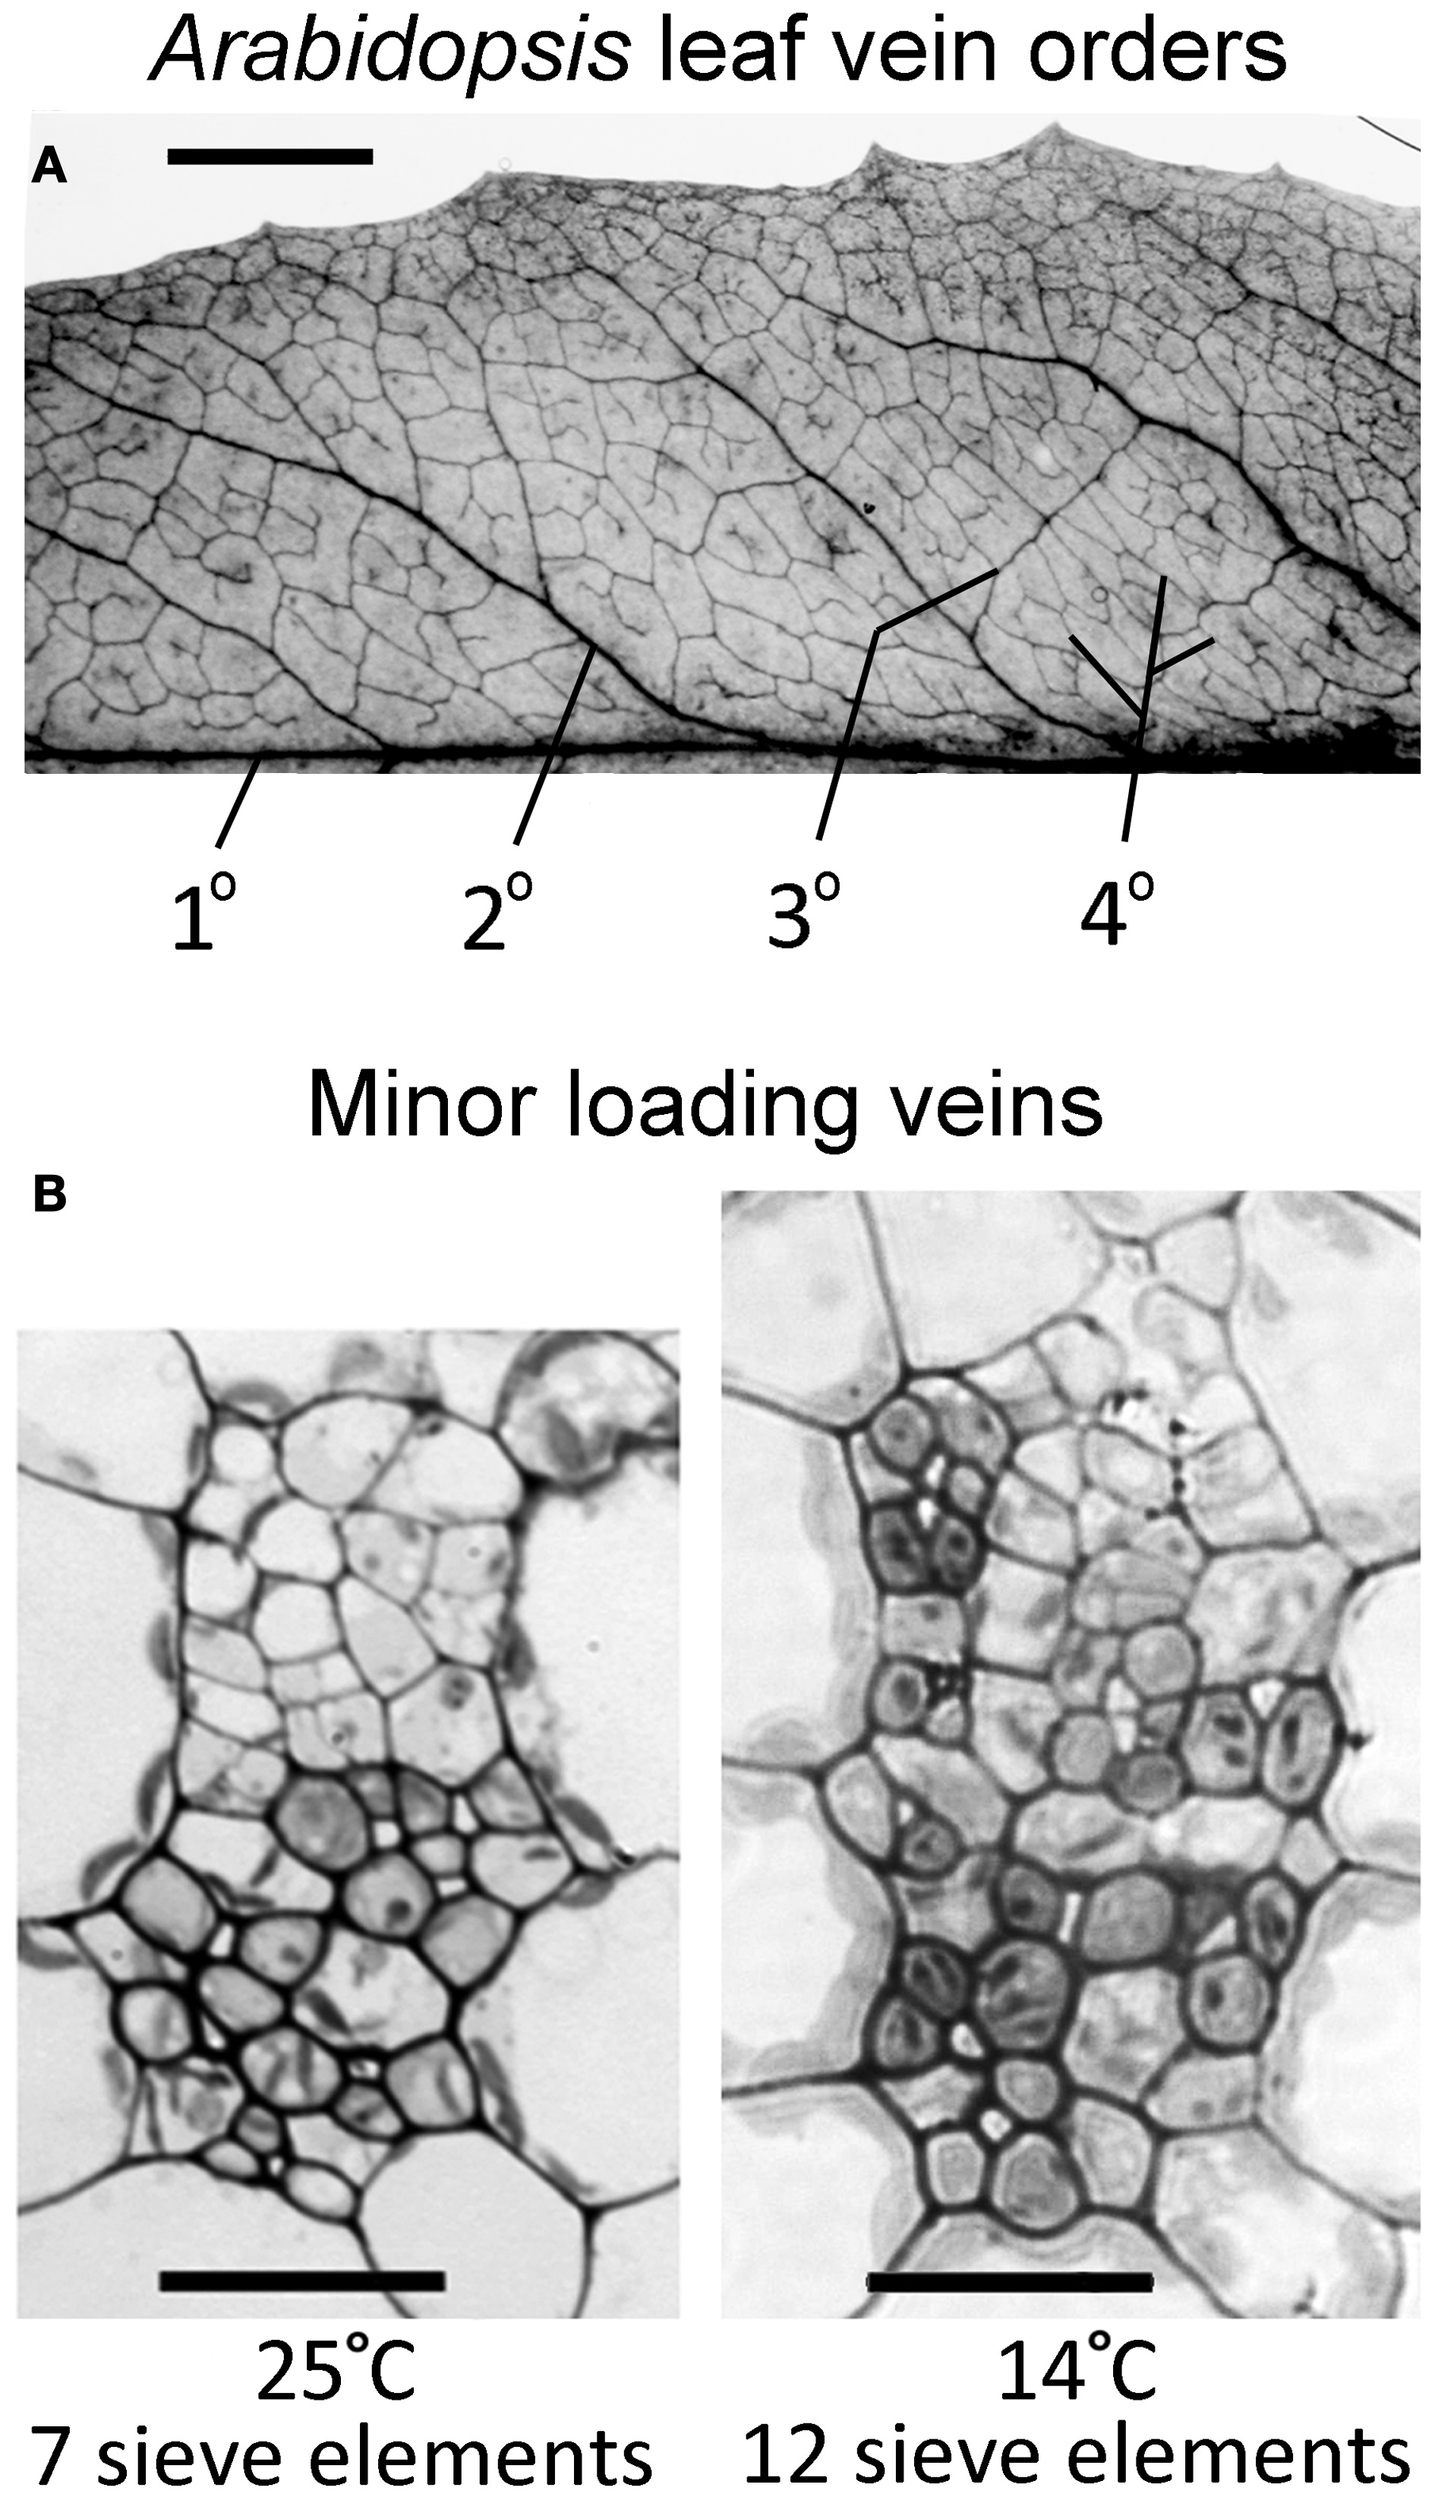
Panel A shows a network; panel B shows tissue sections. The left B section is the main identification example. Open the source at full size to examine small cells.
Check the identification key
In left panel B (25 °C), the authors identify upper xylem and lower phloem. In right B (14 °C), some phloem extends towards the upper xylem region. These are growth-condition anatomy examples, not measurements of current transport rate. Panel A uses a 5 mm bar; the B sections use 20 μm bars.
Use the correct panel
The published Arabidopsis figure contains a leaf-vein network in panel A and two transverse vein sections in panel B. Use the left B section, labelled 25 °C, for the main identification: xylem occupies the upper region and phloem the lower region, following the authors’ key.
Arabidopsis is a non-woody dicot. The network view shows where veins run; the sections reveal tissue layout. These are different views, so you cannot identify an individual phloem cell from the network alone.
A useful variation, not a contradiction
The right B section, from a plant grown at 14 °C, has phloem cells extending towards the upper xylem region. This demonstrates why real image identification needs the source key as well as the typical model. It does not mean that xylem has become phloem.
The figure’s growth temperatures describe how leaves developed. They do not report an instantaneous water-uptake experiment. The source section scale bars are 20 μm; the vein-network scale bar is 5 mm. Keep those scales separate.
Pause and explain
How should the 14 °C panel be interpreted?
Worked example
Which view identifies upper xylem and lower phloem most directly: panel A or left panel B?
Show the worked solution
- A is a vein-network view.
- Left B is a transverse section with the published upper/lower tissue identification.
Answer Left panel B (25 °C) is the relevant tissue section; A shows the vein network.
Try a topic test
Choose Easy, Normal or Difficult. Save your answers and open worked review after finishing.
Test this topic →From guided practice to a new situation
Write your answer and reasoning first. Use a hint only if you are stuck. The model solution is for self-checking; your written work is not automatically marked.
Name the upper and lower transport regions in the left B section.
Give me a hint
Use the 25 °C panel and source key.
Compare my reasoning
- Locate the upper xylem region.
- Locate the lower phloem region.
Upper: xylem; lower: phloem, in the left B section.
Look for these in your work
- Choose the correct panel
- Identify both tissue regions
Why can the right B section not be labelled accurately using only “all upper cells are xylem”?
Give me a hint
Use the documented variation.
Compare my reasoning
- The authors identify some phloem cells extending into the upper region.
- A positional shortcut is insufficient for every cell in this specimen.
Some upper-region cells belong to phloem in the documented cool-grown example; use the tissue key rather than a universal upper-cell rule.
Look for these in your work
- Recognise the variation
- Retain specimen-specific identification
A student uses the 5 mm bar from A to estimate a B-section cell. Identify the error and the correct bar.
Give me a hint
Read the source’s panel-specific scales.
Compare my reasoning
- The 5 mm bar belongs to the network view.
- The B sections use 20 μm bars.
The student mixed panel scales. Use the 20 μm bar for the B section, not the 5 mm network bar.
Look for these in your work
- Identify scale mismatch
- Select 20 μm for the section
Common mistakes
- Using the leaf-network scale bar for a cell section.
- Treating growth temperature as a measured transport rate.
What can you explain now?
How should the 14 °C panel be interpreted?
Compare with the explanation
As a documented tissue-layout variation
The source key describes phloem encroaching towards upper xylem.
After trying it yourself, choose your next review. This is your self-assessment.
Your review choice appears on Today. Sign in to sync it across devices.
Make it stick
Explain the difference between a vein-network view and a transverse tissue section.
If you needed the solution, close it and solve the problem again from a blank page. A correct answer is stronger when you can explain the reason for each step.