Read a genuine guard-cell and chloroplast micrograph
Interpret documented fluorescence while separating cells organelles and the pore.
Core and Extended; Biology 0610, 2026–2028. Use the stated specimen features and evidence. Diagrams are schematic. Written practice is self-checked
Before you begin
- Recall chloroplasts, enzymes and the difference between photosynthesis and respiration.
- Use the stated observations, quantities and controls; diagrams are schematic.
Work on paper. Try each question before revealing help, and explain why your method works.
Quick readiness check
Which feature is the pore in this micrograph?
What you will learn
- Interpret documented fluorescence while separating cells organelles and the pore.
- Use the stated evidence to explain the method and its limits.
Inspect a genuine guard-cell micrograph
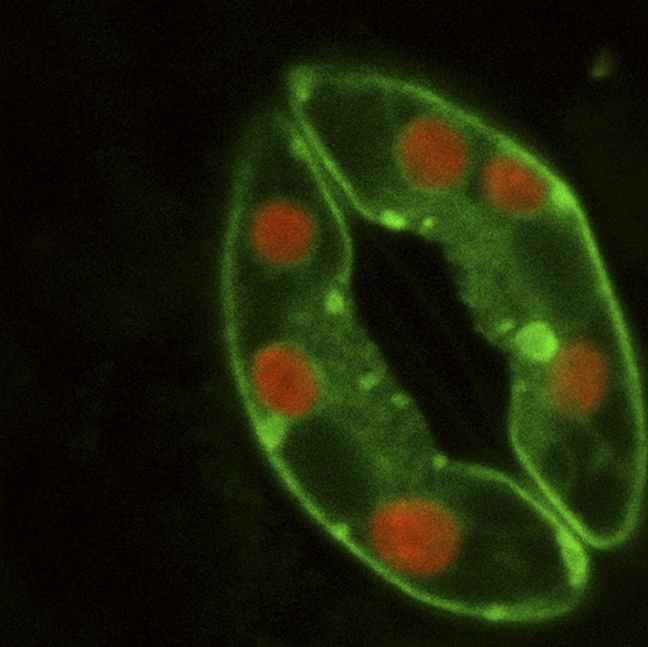
Two green guard cells surround a dark central pore in this Arabidopsis confocal image. Green is the fluorescent protein marker and red is native chloroplast fluorescence, not the natural daylight colour of chlorophyll. The still image does not measure gas flux, opening movement or a calibrated cell size.
Use the documented signal identities
This genuine confocal micrograph of an Arabidopsis stoma was published with an image credit to Alex Costa. Two curved guard cells surround a dark central pore. The source identifies green fluorescent-protein signal in the guard cells and red chloroplast fluorescence within them.
The red structures are chloroplasts in this documented imaging method, not evidence that chlorophyll is a red pigment in ordinary light. Identify organelles from the source signal key and their location inside cells, rather than applying a natural-colour rule to a fluorescence display.
Read structure without inventing motion
The dark region between the two cells is the pore. The image shows an opening and its bordering cells at the recorded moment; it does not by itself measure pore motion, gas-exchange rate, all surrounding tissue layers or the mechanism controlling aperture.
Connect the structural evidence with the model: guard cells regulate the pore and chloroplasts are located within them. A real image strengthens identification practice but is not proof that every labelled cell in another specimen uses the same fluorescent markers. Without a calibrated scale bar, avoid calculating actual cell size from its displayed pixel dimensions.
Pause and explain
Can the image alone establish an exact gas-exchange rate?
Worked example
Identify the two green curved regions, red internal regions and central dark gap using the documented fluorescence key.
Show the worked solution
- Green curved regions: guard cells.
- Red internal signals: chloroplasts.
- Central dark gap: stomatal pore.
Answer Guard cells around a stomatal pore, with chloroplasts visible as the documented red fluorescence.
Try a topic test
Choose Easy, Normal or Difficult. Save your answers and open worked review after finishing.
Test this topic →From guided practice to a new situation
Write your answer and reasoning first. Use a hint only if you are stuck. The model solution is for self-checking; your written work is not automatically marked.
Identify the red internal regions using the supplied source key.
Give me a hint
Use the documented fluorescence identity.
Compare my reasoning
- The red signal is native chloroplast fluorescence.
- It is located inside the guard cells.
Chloroplasts.
Look for these in your work
- Use the key.
- Distinguish organelles from whole cells.
Explain how the visible pair of cells and its central gap relate to carbon dioxide access.
Give me a hint
Connect structure with controlled gas exchange.
Compare my reasoning
- Guard cells border and regulate the stomatal pore.
- An open pore can permit carbon dioxide diffusion toward leaf tissue.
- The direction depends on the gradient.
Guard cells regulate an opening through which carbon dioxide can diffuse when the gradient supports entry.
Look for these in your work
- Name pair and pore.
- Connect to diffusion.
A student calculates actual guard-cell width directly from image pixels, without a scale bar or calibration. Why is that unsupported?
Give me a hint
Pixels describe the displayed image, not specimen length.
Compare my reasoning
- Image magnification or a calibrated reference is missing.
- Screen resizing can change pixel dimensions.
- Use a documented scale or calibration before calculating specimen size.
Pixel width alone does not establish actual cell size without a scale or calibrated magnification.
Look for these in your work
- Identify missing calibration.
- Avoid inventing a physical size.
Common mistakes
- Fluorescence display colour is not ordinary pigment colour.
- A still image does not measure opening speed or gas flux.
What can you explain now?
Can the image alone establish an exact gas-exchange rate?
Compare with the explanation
No; a rate measurement over time is needed.
The image records structure at one moment.
After trying it yourself, choose your next review. This is your self-assessment.
Your review choice appears on Today. Sign in to sync it across devices.
Make it stick
Label the cells, pore and chloroplasts, then state what the still image cannot measure.
If you needed the solution, close it and solve the problem again from a blank page. A correct answer is stronger when you can explain the reason for each step.